Ethereum has seen a slight bounce over the past few days after finding support near $2,500. While the price action remains technically bearish overall, there has been a slight improvement in structure in the short term. However, caution is still warranted as overall resistance levels loom on the horizon.
Technical analysis
By Cheyenne
Daily chart
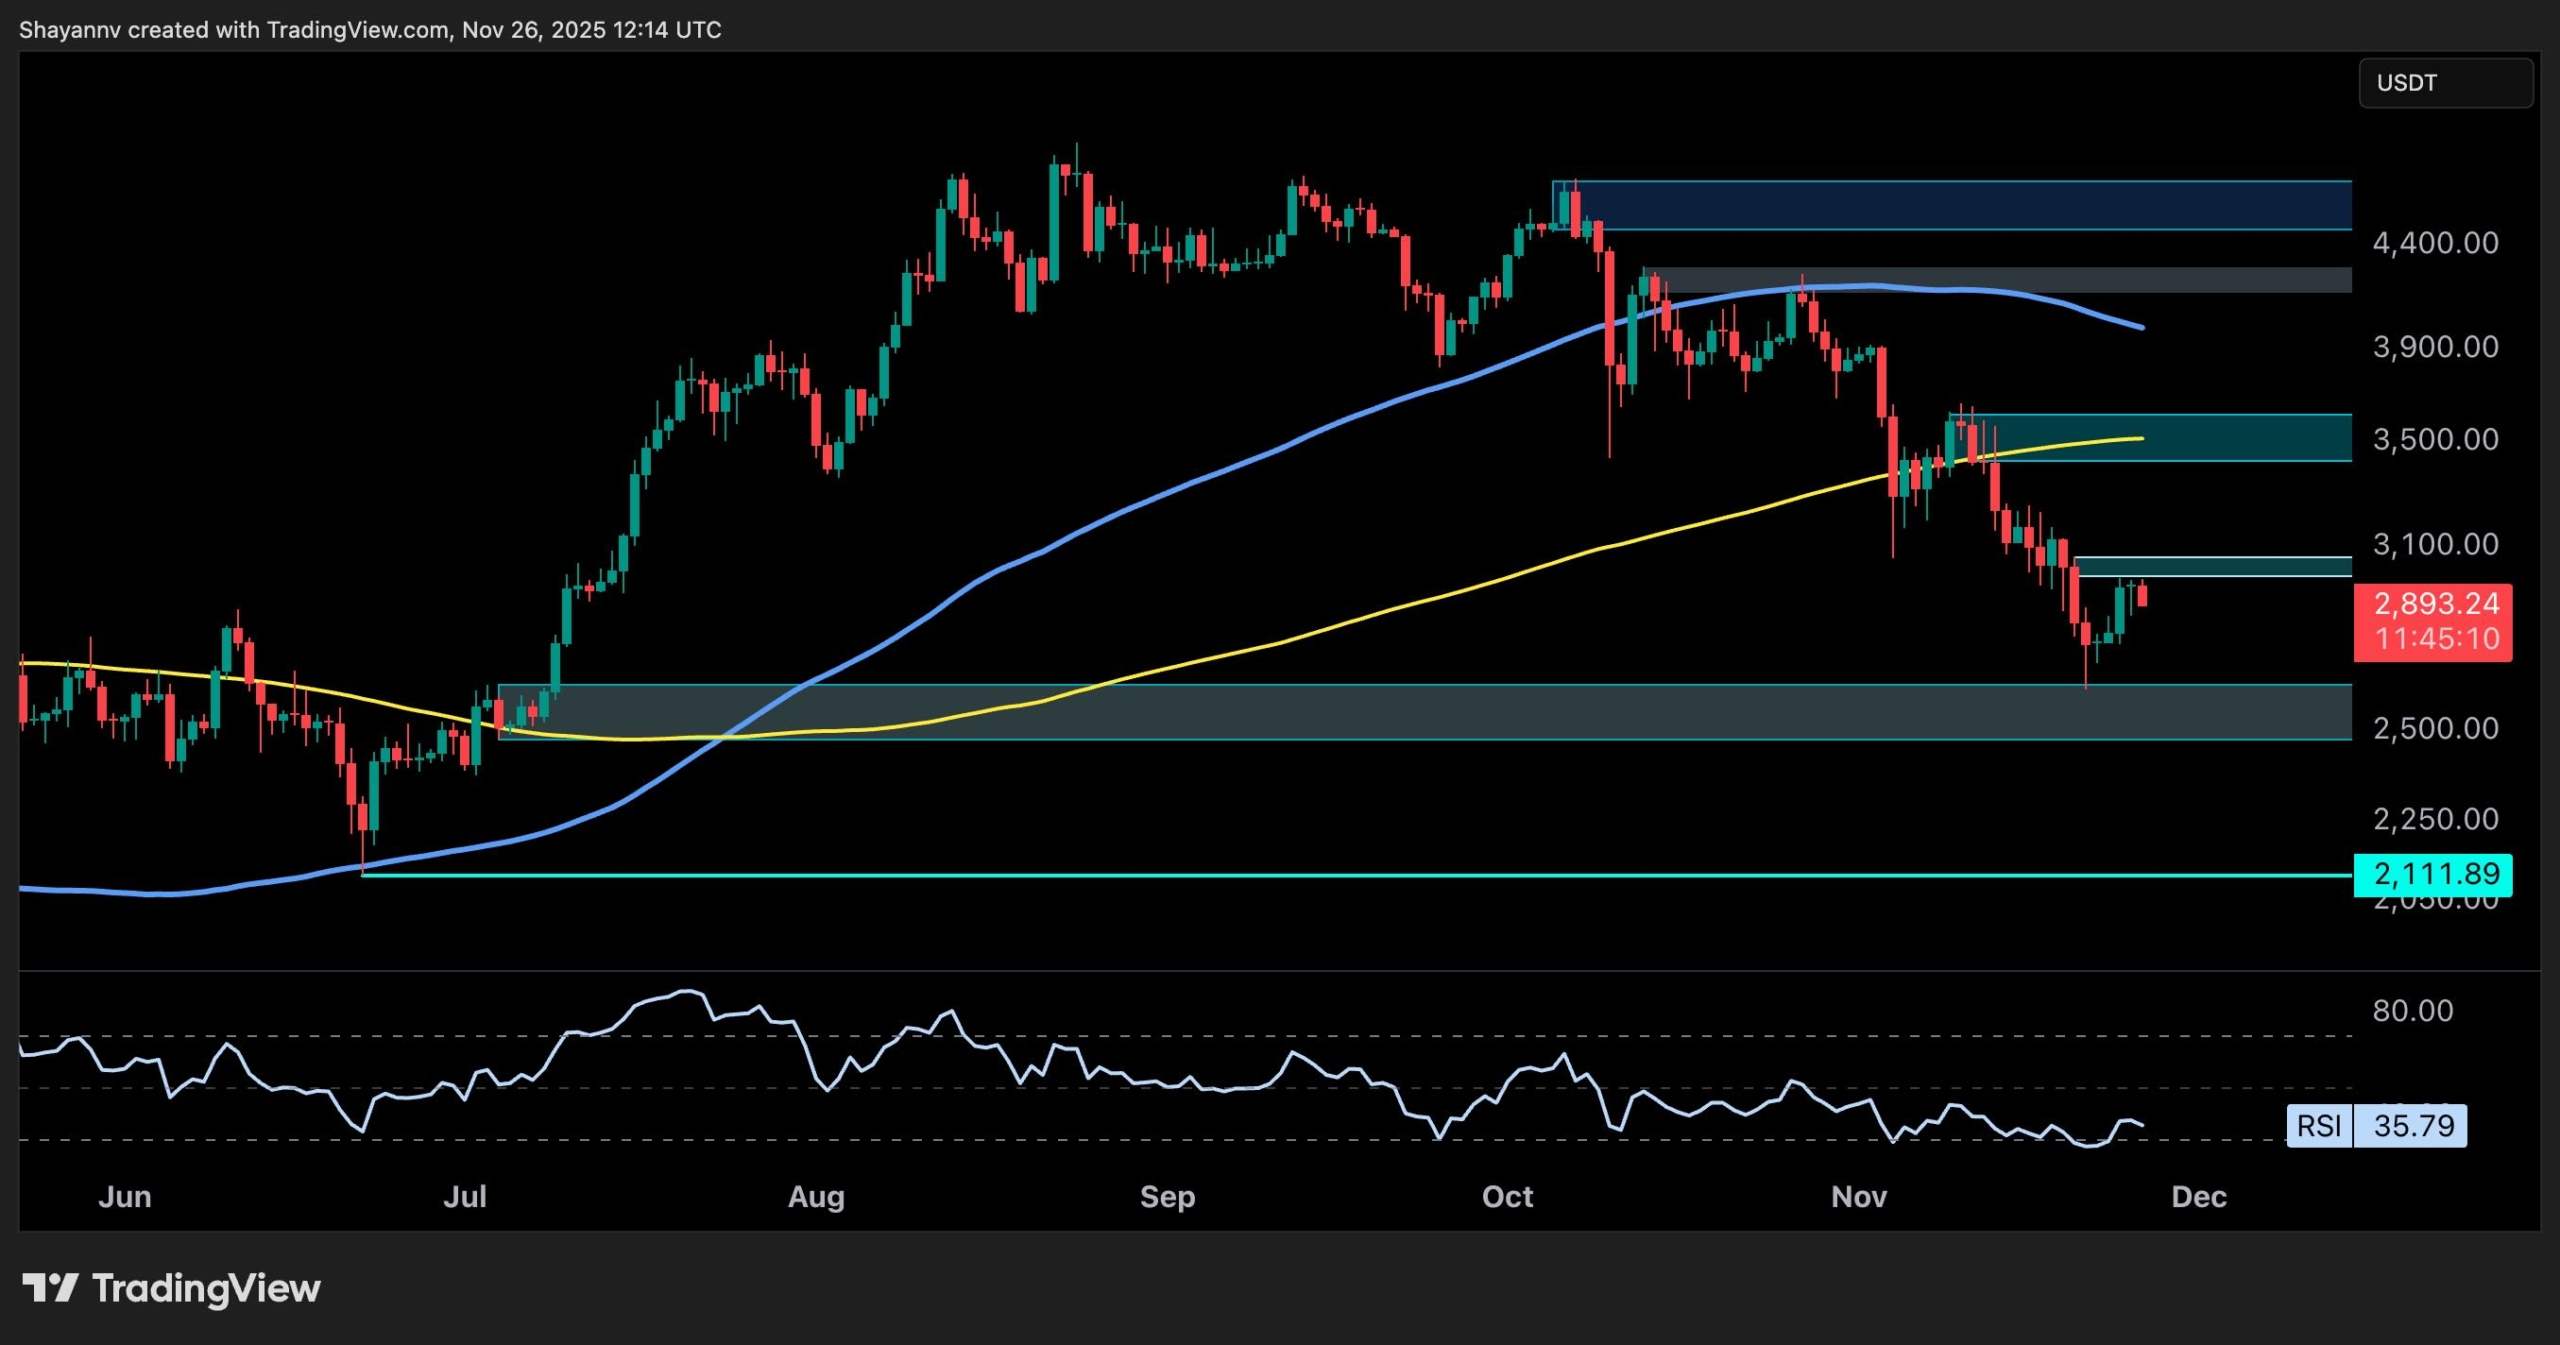
On the daily time frame, it is clear that ETH is currently trading around $2,900 after bouncing from the $2,500 demand zone. This level remained as strong support, sparking a short-term rally that has now seen the asset reach a secondary supply zone near $3,000. The RSI has also moved away from oversold levels and now lies near 36, indicating some cooling in the bearish momentum.
However, the price is still well below the 200-day (yellow) and 100-day (blue) moving averages, which act as dynamic resistance. To turn the structure back to the upside, ETH needs to reclaim the $3,500 area and consolidate above it. Until then, upward moves are considered corrective. Failure here could lead to another decline towards $2,500 or even the critical low at $2,100.
Four-hour chart
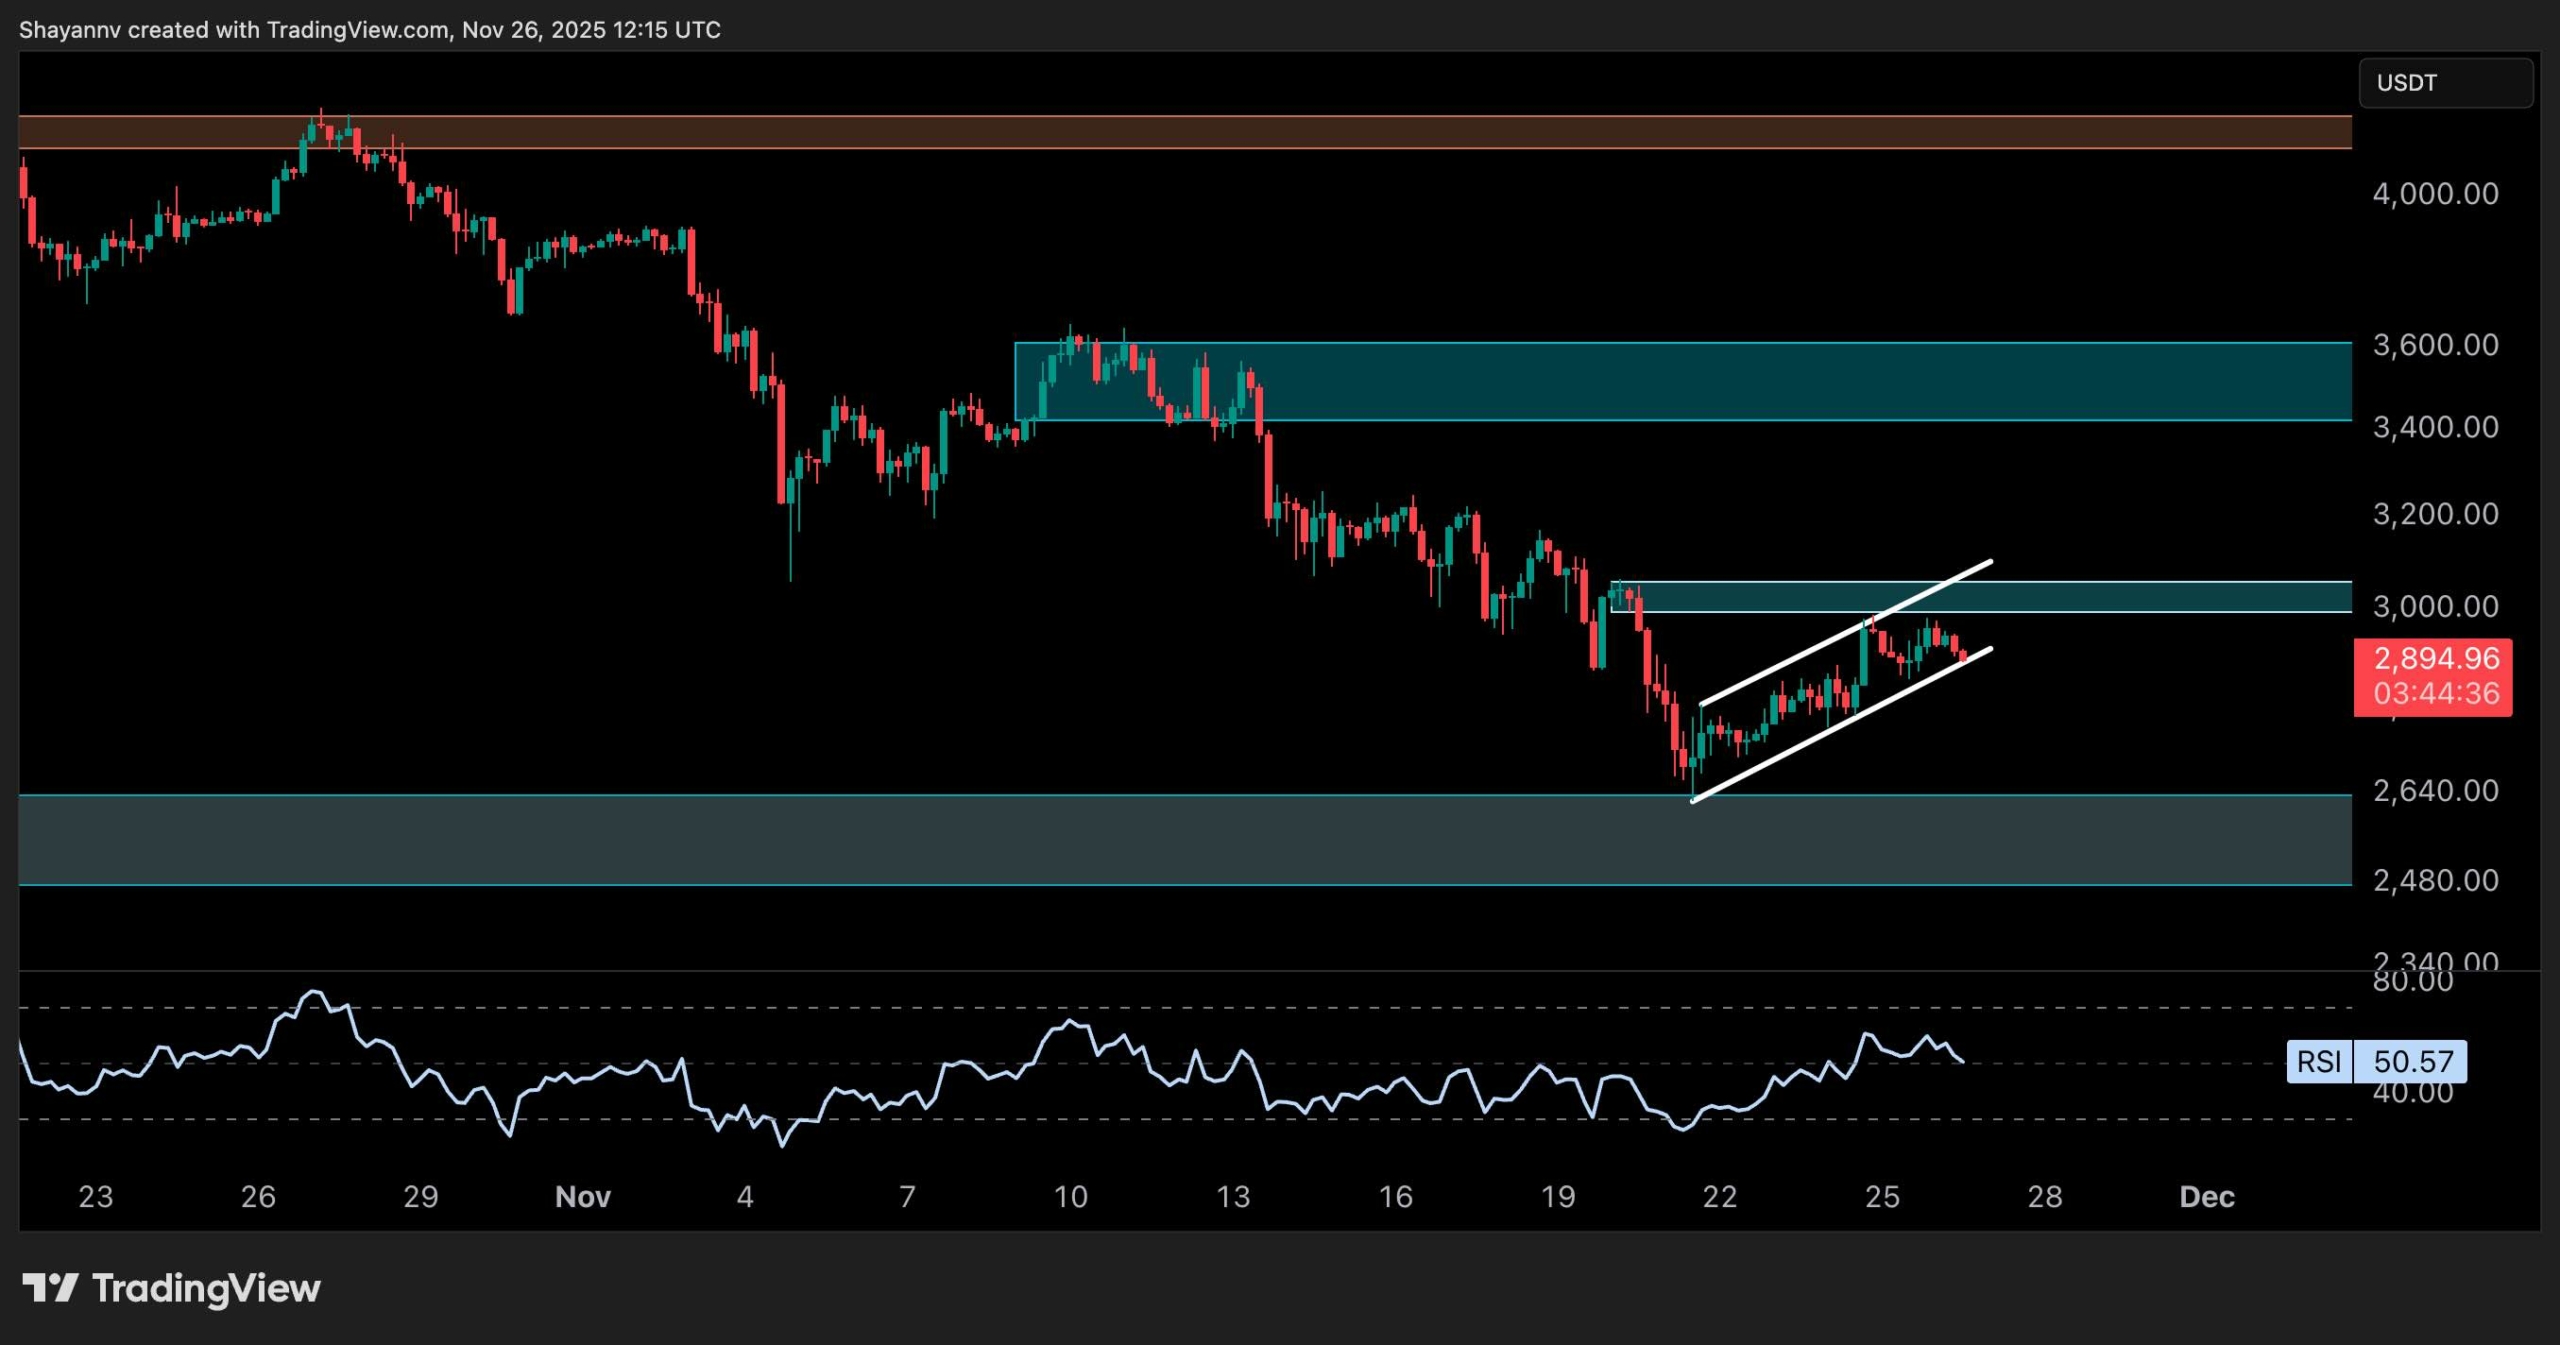
On the 4-hour chart, ETH formed a bear flag just below the $3,000 resistance level. This pattern often indicates potential downside on a breakdown. The price was unable to break the key supply zone at $3,000 and is now showing signs of stalling, with the RSI hovering near the 50 level.
If this flag breaks, the immediate downside target is the $2,600-$2,500 demand zone. On the flip side, a break above $3,000 on strong volume could invalidate the flag and open the door towards $3,500. However, as resistance is gathering, buyers should be careful here and not chase long trades in key areas.
Sentiment analysis
Open interest
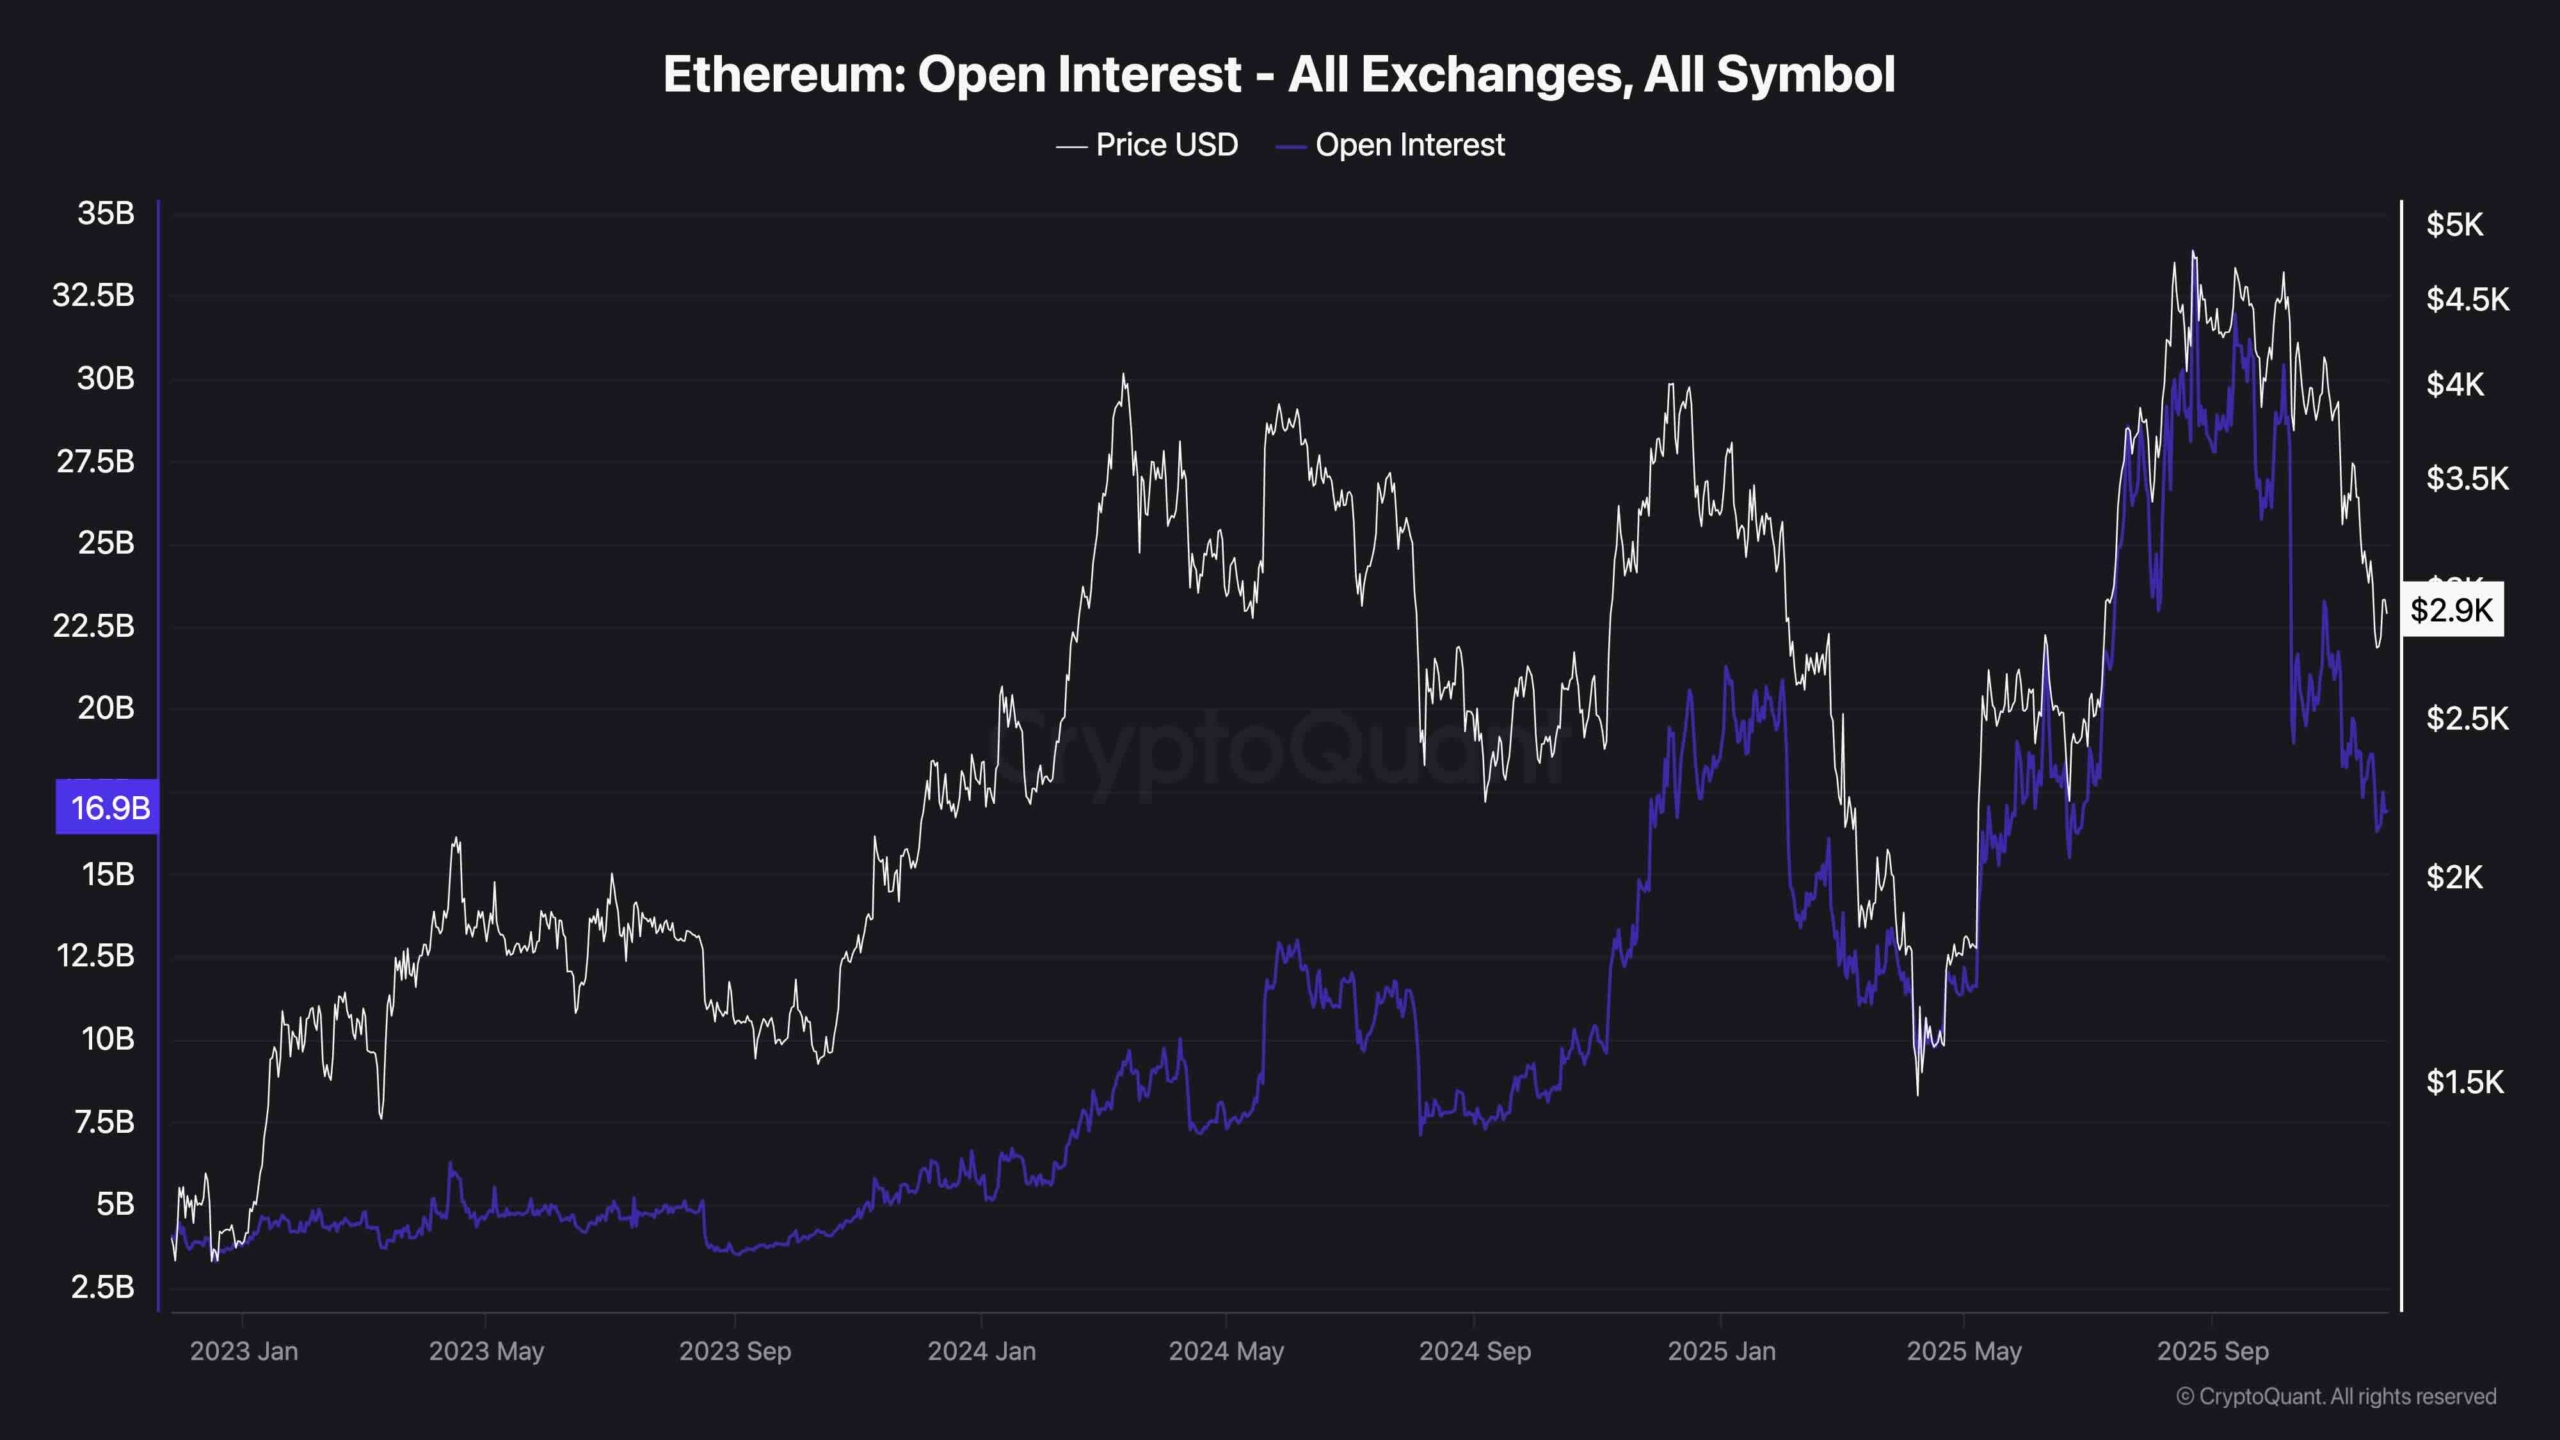
Looking at broader sentiment and futures data, open interest on Ethereum has declined significantly over the past week, and is now approaching $16.9 billion. This slowdown in direct investment, coupled with lower financing rates, indicates a decline in speculative positions, which is often a sign that the market is moving to a more neutral state after a wave of forced liquidations.
The decline in open interest is also consistent with the recent price rebound, which has not been heavily supported by leverage, and is typically a healthier type of rebound. However, the fact that OI has not yet rebounded indicates that market participants are hesitant and unconvinced about this move.
Until both open interest and price start rising again, the bias remains cautious. Many traders will likely be sidelined or risk off before major resistance.
Secret Partnership Bonus for CryptoPotato Readers: Use this link To sign up and get $1,500 in exclusive BingX Exchange rewards (limited time offer).
Disclaimer: The information contained in CryptoPotato is that of the cited authors. They do not represent CryptoPotato’s opinions on buying, selling or holding any investments. We advise you to conduct your own research before making any investment decisions. Use of the information provided is at your own risk. See our disclaimer for more information.
Cryptocurrency charts By TradingView.


