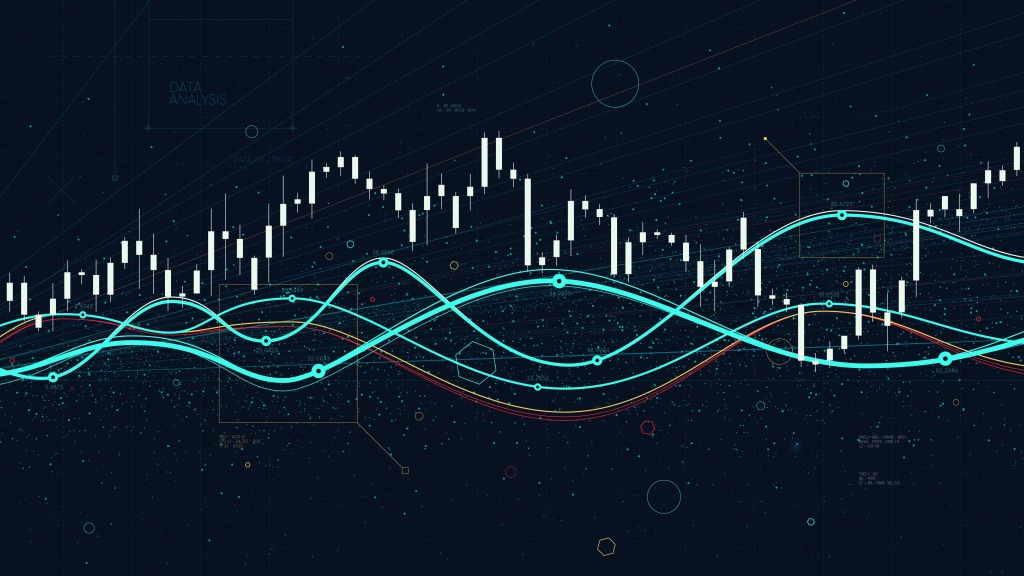
Best indicators for cryptocurrency trading
Now that you understand the types of indicators, here are the best indicators for cryptocurrency trading that one can try in 2022.
Relative Strength Index (RSI)
The RSI is a type of oscillator developed by Welles Wilder in 1978. This strategy is represented by single lines moving sideways between two parallel lines. This indicator can measure the movement, speed, and magnitude of price change depending on overbought or oversold conditions in the market.
The Relative Strength Index (RSI) ranges from 0 to 100 to analyze the market trend. A score below 30 indicates that the cryptocurrency asset is oversold, while a score above 70 indicates that it is overbought.
In some cases, the trend can relax into overbought or oversold territory for extended periods. Many cryptocurrency investors feel that the Relative Strength Index (RSI) is a great tool to combine with other indicators and increase the chances of beating the market.
You can get signals for entry and exit times using the Relative Strength Index (RSI), allowing you to set up or leave a trade to ensure good returns on your investment. You can also detect divergence signals according to the current trend of the asset price.
Moving Average (MA)
The Moving Average (MA) is a great tool that can be used in the cryptocurrency market to better understand price movements. The moving average indicator is used in technical analysis to evaluate the average price of an asset over different time periods.
This technical indicator can predict the trend direction based on bullish or bearish signals in the market. You can modify the time frames you want to consider on the price chart, such as 20 days, 50 days, and 200 days.
Furthermore, the choice of time frame by a trader refers to the approach used to evaluate support and resistance levels in the market. If the trader chooses a 200-day period, this indicates the motivation for long-term trades and highlights that the trader will patiently monitor market trends.
Moving averages are also known as lagging indicators based on their function of providing delayed feedback after price action has occurred. They have different types depending on the approach adopted by the trader but they work efficiently when deployed in groups.
Simple Moving Average (SMA)
The simple moving average indicator effectively captures trends that do not change quickly. It is calculated by summing the closing prices over a given time frame and dividing them by the total number of periods taken into account.
The SMA approach allows traders to evaluate average price movements, and is recommended for long-term investors. It is based on the candle sticks shown on the data chart. Once a new candle appears, this indicator changes its position.
Smoothed Moving Average (SMMA)
The SMMA approach is a bit more complex than the simple moving average (SMA) because it provides a narrower analysis of market trends. It takes into account a longer period to provide a clearer picture to determine support and resistance levels.
The SMMA indicator includes more historical data compared to the simple moving average, eliminating short-term fluctuations that can lead to destructive trading signals.
Exponential Moving Average (EMA)
The Exponential Moving Average is a great tool for day traders because it summarizes recent and historical data to provide a better picture of the price chart. It reduces lag and short-term price momentum, allowing for faster trading decisions.
The Exponential Moving Average calculates moving averages prioritizing recent data over historical data for reliable trend assessment making it one of the most accurate crypto indicators for day trading purposes.
Weighted Moving Average (WMA)
A weighted moving average is another popular type of moving average that is popular among short-term traders. It measures trend by using data to calculate moving averages from the most recent daily closing prices of an asset, taking a stepwise approach to forecasting short-term market movements.
It is a great tool that can be complemented with other moving average indicators in order to better understand the changing trends in cryptocurrency trading.
Bollinger Band (BB)
Bollinger Bands is a type of cryptocurrency indicator that can be used to predict short- and long-term price momentum and highlight the dispersion of the asset price over an average value. It uses the concept of standard deviation to calculate market volatility and provide a clear sense of direction to the trader.
Furthermore, the Bollinger Bands indicator consists of three components: the upper and lower bands with the middle band. The middle band is a simple moving average line with two lines of positive and negative standard deviation on either side.
As volatility increases, the distances between the bands also increase, indicating that the trend is running out of momentum. The most important feature of these indicators is the “squeeze effect”, which highlights reduced volatility in the market, thus enabling the trader to take advantage of market conditions.
The price movement is towards the upper band if the market is in the overbought zone. On the other hand, if the market is in the oversold zone, the price shrinks towards the lower band so you can make your trading strategy accordingly.
By analyzing the upper and lower range, you can make purchasing decisions related to the cryptocurrency asset. Therefore, the Bollinger Bands indicator can be an effective indicator in helping you form the trading strategies required to achieve amazing returns on your investment.
Moving Average Convergence and Divergence (MACD)
The Moving Average Convergence Divergence (MACD) consists of three components: a MACD oscillator, a single line, and a histogram. Convergence refers to two different moving averages moving towards each other, while divergence refers to two fundamental moving averages separating from each other.
The MACD indicator interprets the line, momentum and trend of asset prices to determine whether it is following an uptrend or depicting a bearish signal to the investor. When the MACD line moves above zero, this is a bullish signal indicating a good entry point. Likewise, when the MACD line drops below zero, it is a good time to exit the market.
The MACD indicator detects weakness in an uptrend using moving averages to assess when prices start forming new values. The MACD line is the faster line, while the signal line is the shorter line and their movements indicate trend institutions.
When the MACD line crosses the signal line (slower line), this indicates the start of a new trend. Therefore, the Moving Average Convergence Divergence indicator can be a great indicator for technical analysis, especially in the case of trend divergence.
MYC trading indicator
The MYC indicator is a trading tool that combines momentum oscillators and trend analysis to predict whether cryptocurrency assets will follow an upward or downward trend. It provides a trend line that enables traders to evaluate whether a long signal will be provided when the price of an asset rises.
Unlike other indicators such as Bollinger Bands and the Relative Strength Index, the MYC momentum indicator provides precise entry points that enable traders to catch any opportunity they can take advantage of according to the current trading price.
Ichimoku cloud
Ichimoku Cloud is a visual tool that is a combination of several technical indicators. It uses support and resistance levels and five component lines to create the cloud. The cloud formed then indicates trends according to price changes.
Moreover, this indicator can be a great tool for day traders, and can be complemented with other tools to confirm trends and ensure good returns on your cryptocurrency investment.
Fibonacci retracement indicator
This indicator allows traders to identify turning points in prices to know the right time to enter and exit the market. It analyzes support and resistance levels so that traders know the direction of the ongoing trend.
Stochastic oscillator indicators
This is a kind of leading indicator that determines the strength of momentum between the average value of the cryptocurrency. It compares the closing price of an asset in a high and low range in a certain period of time.
The closing price of a crypto asset can indicate buying or selling momentum, indicating the right time to enter or exit the market.
Trading indicators vs your trading strategy
A trading strategy is a comprehensive approach with a specific goal and action plan to mitigate risks and make profitable trades in the cryptocurrency market. However, cryptocurrency trading indicators provide you with a sense of the direction to follow if you want to beat the market.
Therefore, the trading strategy can be supplemented with trading indicators if the trader aims to succeed in the market. These indicators can be an essential part of your strategy providing you with useful insights into entry and exit points for the market.
FAQ: Are crypto indicators worth it?
Do technical indicators for cryptocurrencies work?
Although the best technical analysis indicators for cryptocurrencies allow a trader to gain valuable insights into the market, the cryptocurrency market is a relatively new concept with little historical data which makes accurate forecasting a difficult process.
Therefore, you can use technical indicators to trade cryptocurrencies, but it is recommended not to rely solely on them to make informed decisions.
What are social media trends?
Social media trends are online marketing strategies that can be a great option for assets with a smaller market cap. The main types of these indicators include the Crypto FOMO indicator and the Fear and Greed indicator.
FOMO indicators measure price increases as a result of people buying assets out of fear of losing them. In contrast, the Fear and Greed indicator provides sentiment analysis as a result of trend reversals.
What is the best indicator for cryptocurrencies?
The best indicators in cryptocurrency trading vary according to individual investors. Your personality and situation determine the suitability of a trading indicator, so it is important that you consider a comprehensive overview when choosing the best indicator for your trading needs.
Final thoughts
Here we have a detailed guide on the best cryptocurrency indicators to follow in 2022. Regardless of your trading style, these indicators can provide valuable market insights that can lead to beneficial trades.
However, you should understand that this is not financial advice, and this content is recommended for educational purposes only. You need to consider all aspects of your situation, such as your trading style and goals, to determine which index may be right for your investment needs.
We hope that this article will enable you to select the best indicator for cryptocurrency trading that will make your investments worthwhile.