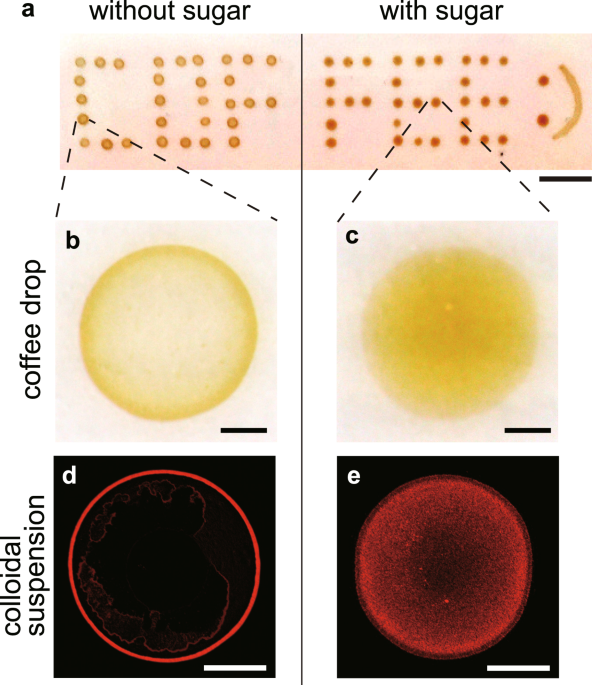
Boiled water at a temperature of approximately 80 °C was poured into ground coffee powders to make a brewed coffee. When a coffee drop (0.5 μL) was evaporated on a solid substrate (here pre-cleaned ceramic dish plate), a ring-like stain was observed (Fig. 1a,b). During the evaporation, the temperature and relative humidity were fixed, i.e., T = 298 ± 2 K and RH = 40 ± 3%. The particle size was approximately 100 nm in radius using dynamic light scattering (Supplementary Fig. S1). In contrast, when sugar (caster sugar, ~98% sucrose) was used to moderately sweeten the coffee (a 0.5 μL coffee drop with a sugar concentration of 200 mM), no ring-like stains were observed, and the stains were somewhat uniform (Fig. 1a,c).
To make the particle distribution clear, we used colloidal suspensions of fluorescent polystyrene (580/605 nm, 1 μm in diameter) that mimic coffee drops. When a drop (0.5 μL, 0.1 vol%) without sucrose was evaporated, a ring-like deposit was observed under a fluorescent microscope (Fig. 1d). In contrast, when a drop with a sucrose concentration of 200 mM was evaporated, the particles exhibited a uniform distribution (Fig. 1e). Investigating the patterns as a function of sucrose concentration from 10−2 to 103 mM revealed that the ring-like pattern changed to an uniform pattern through an intermediate pattern as sucrose concentration \({\varphi }_{{\rm{suc}}}\) increases (Fig. 2a). To quantitatively investigate the change, we estimated the areal particle number density, ρ(r), as a function of radial distance, r, from the droplet centre for drops with \({\varphi }_{{\rm{suc}}}={10}^{-2},{10}^{-1},{10}^{0},{10}^{1},{10}^{2}\) and 103 mM (Fig. 2b). The particle density ρ(r) and radial distance r are normalized by the total particle number N and the deposit radius R, respectively. For drops with low sucrose concentration (\({\varphi }_{{\rm{suc}}}\) = 10−2 and 10−1 mM), the density profile has a large peak, ρ(r)/N ~ 0.4, at r/R ~ 1. For the drops with a medium sucrose concentration (\({\varphi }_{{\rm{suc}}}\) = 100 mM), the profile has a smaller peak, ρ(r)/N ~ 0.2. In contrast, for drops with a high sucrose concentration (\({\varphi }_{{\rm{suc}}}\) = 101, 102 and 103 mM), the profile does not have any peak. Rather, for \({\varphi }_{{\rm{suc}}}={10}^{3}\) mM, the density appears higher at the centre. As \({\varphi }_{{\rm{suc}}}\) increases, the final deposit becomes thicker. As a result, for \({\varphi }_{{\rm{suc}}}={10}^{3}\) mM, the periphery in the image is out of focus (Fig. 2a), leading to the underestimate of the particle density near the periphery. The change in particle density near the edge, r/R = 0.99, is summarized in Fig. 2c.
Deposit pattern change as a function of sucrose concentration. (a) Evaporative deposits of drops (0.5 μL, 0.01 vol%) with \({\varphi }_{{\rm{suc}}}={10}^{-2},{10}^{-1},{10}^{0},{10}^{1},{10}^{2}\) and 103 mM. The ring-like pattern transits to the uniform pattern through the intermediate pattern. The scale bars are 500 μm. (b) Normalized particle number density, ρ(r)/N, as a function of normalized radial distance, r/R, from the deposit centre for drops with \({\varphi }_{{\rm{suc}}}={10}^{-2},{10}^{-1},{10}^{0},{10}^{1},{10}^{2}\) and 103 mM. (c) Normalized particle number density near the edge (r/R = 0.99) as a function of \({\varphi }_{{\rm{suc}}}\). The black line is a visual guide.
To elucidate the mechanism behind the pattern change, we investigated the evaporation dynamics. We first quantified the initial shapes of drops characterized by the maximum height h0, radius R, and contact angle θ (Supplementary Fig. S2). For ten drops with \({\varphi }_{{\rm{suc}}}\) = 0 and 200 mM, these parameters were estimated by the shape analysis to be (h0, R, θ) = (325 ± 19 μm, 876 ± 36 μm, 35.2 ± 1.8°) for \({\varphi }_{{\rm{suc}}}\) = 0 mM and (h0, R, θ) = (311 ± 10 μm, 857 ± 25 μm, 34.7 ± 2.8°) for \({\varphi }_{{\rm{suc}}}\) = 200 mM. This similarity of the parameter values ensures that the initial shapes are independent of \({\varphi }_{{\rm{suc}}}\). Furthermore, we estimated the evaporation speed from the mass change of drops for \({\varphi }_{{\rm{suc}}}\) = 0 and 200 mM, respectively. The evaporation speed is almost constant in time (−100 μg/s, Supplementary Fig. S3). Regardless of the similar initial shapes and evaporation rates, the deposit pattern of particles completely changes as a function of \({\varphi }_{{\rm{suc}}}\).
Sequential fluoresce images of an evaporating drop with \({\varphi }_{{\rm{suc}}}\) = 0.1 mM reveal that the particles gradually accumulate at the edge and form a ring-like deposit, as observed in the common coffee ring (Fig. 3a, Supplementary Movie 1). In contrast, for a drop with \({\varphi }_{{\rm{suc}}}\) = 102 mM, the particles seem to stop accumulating at t/tf ~ 0.4 and the front moving toward the center was immediately observed, where tf (~200 s) is the total evaporation time (Fig. 3b, Supplementary Movie 2). To see the receding front, we investigated spatio-temporal dynamics of the red solid line in Fig. 3b (Fig. 3c). We moreover evaluated the front dynamics from the time difference analysis of the intensity and found that the particles are motionless behind the front. We also found that the velocity of the receding front is nearly zero till t/tf ~ 0.4, is kept constant (~0.5 μm/s) over \(0.4\lesssim t/{t}_{{\rm{f}}}\lesssim 0.8\), and then greatly increases (Fig. 3d). To observe the onset of the receding event more clearly, the particle behaviour near the contact line was magnified (Fig. 4a–d). Time-resolved fluorescence images (merged with bright-field images) reveal that the accumulated particles at the edge start to move towards the droplet centre at a certain time, which is denoted by ta (Fig. 4a,b, Supplementary Movie 3). Even after t = ta, the particles at the edge continued to move towards the centre, while some were left behind the front. As shown in Fig. 4e, ta increases as \({\varphi }_{{\rm{suc}}}\) decreases, as shown by the black line. The particles at the edge did not move for values of \({\varphi }_{{\rm{suc}}}\lesssim 1\,{\rm{mM}}\) (indicated by the orange colored region).
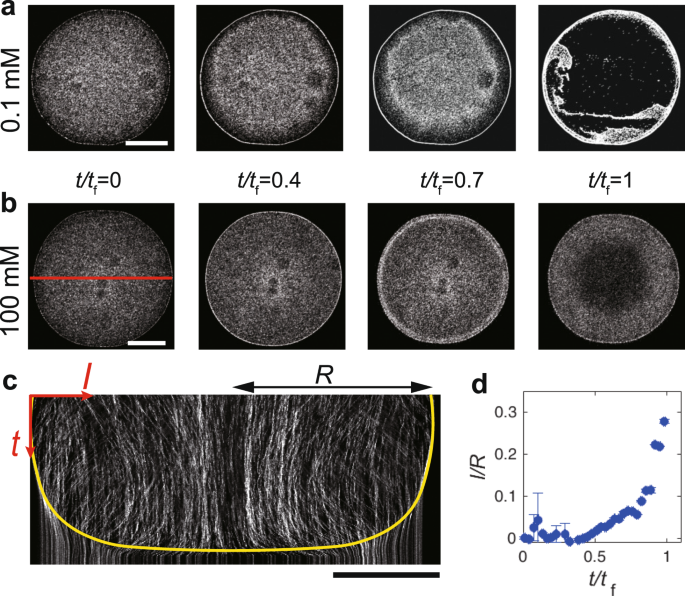
(a,b) Sequential fluoresce images near the bottom during the evaporation of a drop (0.5 μl, 0.01 vol%) of particle suspension with \({\varphi }_{{\rm{suc}}}\) = 0.1 and 100 mM. The scale bars are 500 μm. (c) Spatio-temporal image of the red-solid line in (b). The yellow line is the eye guide of the receding front toward the center. The particles do not move below the line. The scale bars are 500 μm. (d) Distance of the receding front from the droplet edge normalized by the droplet radius, l/R, as a function of normalized time, t/tf, where l and R are the distance of the receding front from the edge and the droplet radius, respectively.
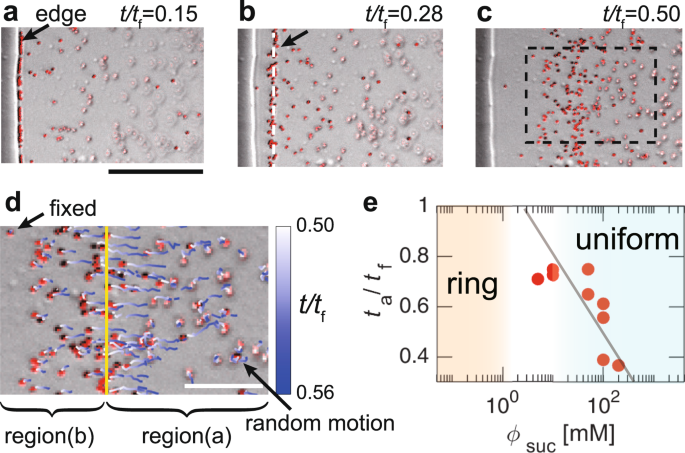
(a–c) Sequential images near the contact line of a drop with \({\varphi }_{{\rm{suc}}}\) = 100 mM at t/tf = (a) 0.15, (b) 0.28 and (c) 0.50, where tf is the total evaporation time. The fluoresce images are merged with bright-field ones. The scale bar is 50 μm. The arrow and white dashed line in (b) show the front of the particles that move towards the centre from the edge. The arrow in (a) indicates the edge of the solid-like sucrose. (d) Particle trajectories are shown by time-dependent colour lines in the rectangle in (c) from t/tf = 0.50 to t/tf = 0.56. The yellow line indicates the front. Regions (a and b) show the inner and outer regions divided by the front, respectively. The scale bar is 20 μm. (e) The normalized time at which the particles start to move inward from the edge, ta/tf, as a function of \({\varphi }_{{\rm{suc}}}\). The line is a visual guide.
For the further investigation, we tracked the particle motion in the rectangle region of Fig. 4c from t/tf = 0.50 to t/tf = 0.56 (here, ta/tf = 0.22) as shown with time-dependent colour lines (Fig. 4d). At t/tf = 0.5, the front (indicated by the yellow line) moved inward with a velocity (~0.5 μm/s). The particles in region (a) seemed to be above the focal plane and underwent random motion in the solution. However, in region (b), some particles were fixed, while others slightly move towards the centre and immediately became fixed. The motionless particles must coexist with solid-like sucrose because the edge (indicated by the black arrow in Fig. 4a) is still remained even after the complete evaporation of water. The physical states of regions (a) and (b) are therefore considered to be liquid-like and solid-like, respectively, suggesting that the solid-like sucrose, which may be an amorphous state, emerged from the edge because of the highest evaporation near the contact line2,3. Then, it should have caused the depinning of the glass-liquid-gas contact line, as suggested by the theoretical studies on the drying process of polymer solutions18,19. Thus, the moving front should correspond to the solid sucrose-liquid-gas boundary (hereafter called SLG boundary) depinned from the glass18. This front has subsequently passed towards the centre with the homogeneous fixation of the particles. This process breaks the ring-like structure of the particles and homogeneously disperses the particles, contributing to the uniformity of the particle coating.
If the depinning of the contact line occurs at t = ta, then the capillary flow can be suppressed1,11,20. To test the hypothesis, we determined the entire flow pattern by performing particle image velocimetry (PIV) analysis21. For drops with low sucrose concentration (\({\varphi }_{{\rm{suc}}}\) = 0, 0.1 and 1.0 mM), the outward radial capillary flow rapidly increased at t/tf ~ 0.9 (Fig. 5a,b,e, and Supplementary Movie 4). When the averaged velocity magnitude, \(\langle |\overrightarrow{v}